Join our Mailing list!
Get all latest news & be the first to know about upcoming events.
Nov 2023
It’s often said “you cannot manage something that has not been measured”. The late Peter Drucker, founder of modern business management theory often stressed this principle. The same can be applied to range management. The end of the grazing season is a great time to monitor your pasture/rangeland resources.
Livestock grazing on rangeland and pastureland is a complex process. Livestock interact with climatic (precipitation, temperature, wind), topographic (slope and orientation), edaphic (soil), and biotic (plants and other animals) factors that make up the grazing environment and act as regulators of nutrient cycling and energy flow. In order to reduce the complexity of this system, Orchard (2013) described a simplified model of these processes and the biotic state and combined it with a monitoring program for ranchers to aid in management decisions.
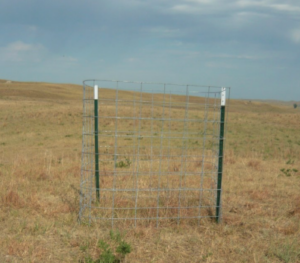
Indicators of these four key areas can be monitored and plotted over time to help the manager identify management strategies to bring the pasture environment back into optimal ecosystem function. Monitoring tools include 1) soil surveys and maps (Web Soil Survey, Google Earth, etc., 2) grazing records (keeping track of number of head, grazing dates), 3) rain gauges (track monthly precipitation and keep a rolling 12- month average, 4) grazing cages (small exclosures used to exclude livestock so that annual forage production and utilization can be estimated), 5) permanent exclosures (recovery pens used to compare several years of no grazing to see if a shift in species composition has occurred), and 6) permanent transects (includes visual estimates, notes, and pictures of indicators.
My favorite monitoring tool is the grazing exclosure. This tool allows you to look at how much forage is produced inside the exclosure and how well the livestock utilized the forage outside the exclosure. If you clip the vegetation inside the exclosure using a grazing hoop, dry it, and weigh it you can get an accurate measurement of total season forage production. Tying those measurements to monthly rainfall data allows you to make site specific predictions for your ranch which you can use to develop your drought plan.
Another practical use of grazing exclosures is to map the utilization across a pasture or ranch. This allows you to see if cattle overgraze or under-graze portions of your pasture. If you have areas that are routinely overgrazed or under-grazed then you might consider subdividing your pasture to get more even distribution.

Jim Gerrish spoke at one of our Winter Road Shows several years back and gave an excellent real world example of this. He showed an aerial photo of a 2,640 acre winter pasture composed of native and seeded rangeland that spanned 2.3 miles diagonally, had no interior fences, and only one water source. They mapped the utilization the first winter and showed the classic pattern of overgrazing on one end of the pasture near the only water source and light grazing on the far end. The number of grazing days per acre was limited to 7.2 animal unit days/acres (AUD/A). The next year they installed a stock water system with eight watering tanks spread out evenly across the pasture. The second winter the pasture supported 13.6 AUD/A because the cows did a better job spreading out over the pasture. In the third year, they installed cross-fencing to create 16 160-acre paddocks and achieved a stocking rate of 29 AUD/A resulting in even grazing distribution on each paddock. Jim provided the economic analysis and showed that the cross-fencing alone provided an additional $36,000 in feed savings which paid for the cross-fencing cost ($33,000) in one year.
A second example of utilization mapping comes from published work out of Kansas State University from Smith and Owensby (1978) comparing intensive-early stocking with season-long grazing. Intensive-early stocking is a practice where you double stock the rangeland but only graze half the season. This grazing method was developed in warm-season grass dominated rangeland grazed by yearlings in eastern Kansas and Oklahoma. The theory is to avoid the typical forage quality declines and poor weight gains in the late summer due to the higher lignified warm-season grass during this time. Also, traditional market prices usually decline for yearlings in September and October. Thus if you double the stocking rate and sell the yearlings in July you take advantage of higher average daily gains and more favorable sale barn prices. The point is that this grazing method is like splitting your pasture in half and grazing it during the first part of the season and resting it the second half. In doing so the stocking density increases and you get better grazing distribution. The pasture map for each grazing system is striking. The season-long continuous grazed pasture has the classic patchy grazed appearance with heavy grazing around the water and light and moderate grazing elsewhere. The intensive-early stocking has a mostly moderately grazed appearance with a little bit of heavy grazing. If you are interested in reading the paper you can find it online at https://repository.arizona.edu/handle/10150/646676. The intensive-early stocking method was more efficient as it produced 34% more beef per acre at the same stocking rate compared with season-long grazing because animal performance declined in for late-summer/early autumn period with season-long grazing.
In conclusion, monitoring pastures at the end of the grazing season is a very important activity to gather information about the performance of your pasture/rangeland. If you are new to grazing or monitoring, reach out to a technical provider like SDSU Extension, NRCS, a Grassland Coalition mentor, or attend a SD Grazing School.
Source: SDGC Newsletter
Get all latest news & be the first to know about upcoming events.