by Sandy Smart
September 2021
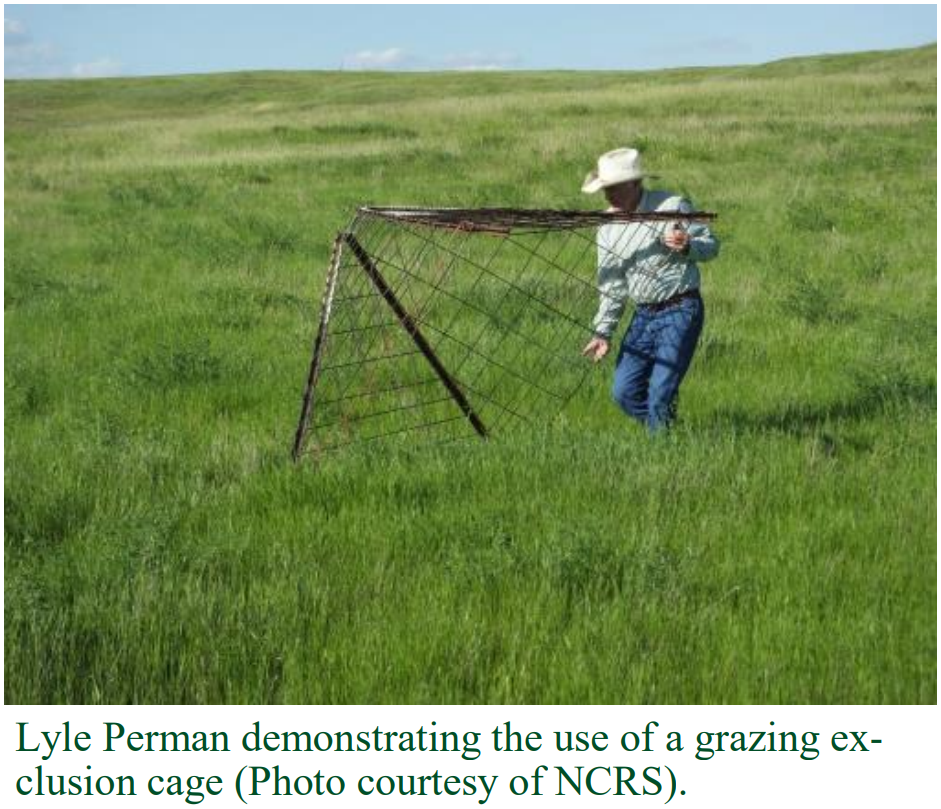
The first method, which is particularly useful, is pasture utilization. This can be done by using a grazing exclusion cage (see photo to the right). Grazing cages exclude livestock from a small area where you can clip the forage biomass at the end of the season to get an estimate of annual forage production. Knowing how much forage your pastures are capable of producing is extremely helpful in determining the stocking rate. If you do this over a long period of time, you can develop a prediction model of how much forage your pastures produce in a dry, normal, and above-normal rainfall year. I have done this for the rotational grazing demonstration site at Jim Faulstich’s place and determined total April precipitation was the best predictor of forage production for the growing season. Second, if you clip outside the grazing cage, you can estimate what is remaining after grazing. Subtracting the remaining forage outside the cage from inside the cage gives you a level of utilization. Having several grazing exclusion cages located throughout a large pasture can provide a map of utilization. This map can be used to help develop management strategies to place future fences, locate salt and minerals, or perhaps add new watering sites to reduce overgrazed areas and reach underused areas of the pasture.
A second method is to measure the heights of grazed and ungrazed key forage species you are managing. This technique requires plant ID skills whereas the clipping method does not. The NRCS recommends measuring at least 30 individual plants, both grazed and ungrazed, of whatever species you are interested in and doing this in several locations within your pasture to get a good average. Then you use a chart that has the percent weight removed in relationship to the percent height removed to determine your level of utilization on the key species you are measuring. This table is available online at: (https://efotg.sc.egov.usda.gov/references/public/SD/No.9-PrescribedGrazing.pdf).
The nice thing about this technique is that you don’t need to put out grazing exclusion cages. However, it does take a little more time to measure 30 grazed and ungrazed plants than clipping plots. You don’t learn how much forage is produced, but you do learn how your livestock select different plants if you choose to measure several species.
Grazing Response Index
The last monitoring tool is called the Grazing Response Index.
The evaluator (rancher or manager) determines a score for three categories:
1) frequency of use,
2) intensity of use,
and 3) opportunity for rest.
The scores range from +2 to –3 depending on how often you graze the same pasture, how intense you graze, and how much opportunity it has for rest.
The National Drought Mitigation Center (https://drought.unl.edu/ranchplan//BeforeDrought/GrazingStrategy/ DecisionSupportToolsforGrazing/GrazingResponseIndex.aspx) has an explanation of how to use it. You can also find a similar decision support tool for warm-season dominated rangeland (Sandhills Defoliation Response Index) on this webpage. We (Dr. Eric Mousel and I) developed a similar defoliation response index for smooth bromegrass-dominated pastures for eastern South Dakota and western wheatgrass/green needlegrass-dominated rangeland for western South Dakota. You can download the ‘South Dakota Rangeland and Pasture Grazing Records’ article through South Dakota State University’s Open Prairie repository at (https://openprairie.sdstate.edu/extension_circ/487/).
The nice thing about this technique is that it is fast and integrates information about how the pasture was used. The purpose is to add up the scores from the three categories. If you have a negative score, it means that the culmination of management for that pasture was hard on the forage resource. Thus, you should devise a future grazing plan to intentionally give that pasture a positive score after the next grazing season is completed. As such, you are trying to offset a negative score with a positive score. This is more of a qualitative assessment (even though we are using numbers) but it includes ecological drivers which are well-founded on research and producer experience.
The bottom line in all things related to management can be summed up by the famous late Peter Drucker “if you don’t measure it, how can you manage it?”. These tools were developed by scientists and practitioners to give managers the ability to take inventory of their management actions. Hopefully, you will find one of these tools useful to your operation.
Sandy Smart is the Ag and Natural Resources Program Leader for SDSU Extension