South Dakota Grassland Coalition

By Sandy Smart

March 2024

Drought planning is an important component of ranch management. A good drought plan should have a series of critical “trigger dates” in which the manager evaluates climate information and makes predetermined decisions to manage the land and livestock resources before it is too late.

April 1, is a great trigger date to look backwards and reflect on the following questions:

  • • How much precipitation was received during last year’s growing season?
  • • How much precipitation was received during the fall and winter?
  • • How moist is the soil now?
  • • What are the rapid drought indices showing now?
  • • What are Climate Prediction Center tools indicating in the 1-, 2-, and 3-month outlooks?

South Dakota Mesonet Ag Weather Tool

To view the growing season precipitation trend compared to the 30-year normal with the Mesonet Ag weather Tool, click on the link ‘Ag Weather Tool’ under the Tools dropdown menu and choose as station nearest you. Through the dropdown menu you can chose the current year or previous year’s dating back to when the particular station was installed. The graph gives you a cumulative curve of precipitation with the 30-year normal as a solid line. If you hover over any particular date, it will display the total and normal rainfall up until that date so you can see the exact difference.

South Dakota Mesonet Archives Local Data

To view a specific period of time such as the previous fall (October-December) and winter (January-March) or an individual month’s precipitation, click on the ‘Archives’ tab and select ‘Local Data’ in the climate archives. Select the weather station, the period, and the year. It is easiest to select one month at a time because it summarizes the information at the top of the page and includes the deviation from normal.

South Dakota Mesonet Soil Moisture

To view the soil moisture at different depths, click on the ‘Archives’ tab and select ‘soil moisture’ from the ‘Select Layer’ dropdown menu on the map. The map will show a series of different colored ‘poker’ chips that correspond from top to bottom the soil depths of 2, 4, 8, 20, and 40 inches. The different colors refer to the percent volumetric soil content of 0, 10, 20, 30, 40, or 50+% water in decimal form. Soil water content of 20-40% are at field capacity on soil texture. You can also view the soil thaw depth from this same page by selecting the ‘thaw depth’ layer. As of March 1, 2024, the southern half of the state’s soil has already thawed. Many locations across the state have soil water content ranging from 10 to 30 percent at the 20 and 40 inch depths.

You can also view a map of soil moisture of South Dakota from 0-200 cm (0-78 inches) from the ‘Climatologist’ tab and select the ‘Drought Dashboard’. On the next page select ‘Soil Moisture’ . The first map shows North Dakota and South Dakota soil moisture percentile. Normal range is 30- 70% and drier is <30% while wetter is <70%. Keep in mind that this is more of an experimental estimate.

South Dakota Mesonet Rapid Drought Development Indicator
4-week Evaporative Demand Drought Index (EDDI) for South Dakota ending on March 8, 2024
Figure 1. 4-week Evaporative Demand Drought Index (EDDI) for South Dakota ending on March 8, 2024. The index takes into account the previous 4 weeks starting on February 8, 2024 into consideration.

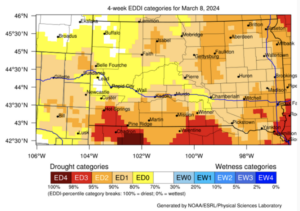
To view the latest drought monitor and more specifically the 4-week Evaporative Demand Drought Index (EDDI), click on the ‘Climatologist’ tab and choose the ‘Drought Dashboard’. From there select the ‘General Drought Information’ to see the current drought monitor and EDDI.The 4-week EEDDI ending March 8th (Figure 1) is particularly interesting this year because it shows the influence of the thawed soils and warmer February temperatures are drying out the soil (Figure 1).

Climate Prediction Center

From the South Dakota Mesonet page if you click on the ‘Climatologist’ tab and choose ‘Drought Dashboard’ and then select ‘Forecasts/Outlooks’ on the next page and you can look at short-term and long-term outlooks on temperature and precipitation. It is recommend viewing the 1-month and 1-3 month outlooks on both temperature and precipitation. Specifically, the April, May, and June 3-month outlook is very important because this is the time period we receive most of our precipitation and most of the annual forage production is produced by July 1. Keep looking at the 3 month forecast every week as the April-June period progresses because the prediction is updated weekly.

You can also go directly to the Climate Prediction Center by visiting the website.

Join our Mailing list!

Get all latest news & be the first to know about upcoming events.